Example - Your First Runnable Graph
A Minimal First Graph
This example walks through a tiny graph that runs on the editor's default scene and shows the full loop from start to finish:
- Add an event block.
- Add a data block.
- Add an execution block.
- Connect them.
- Run the graph and inspect the result.
You can open the finished graph straight in the hosted editor, fully wired and ready to run: Open this graph in the Flow Graph Editor
If you would rather build it from scratch, start with an empty editor instead: Flow Graph Editor. The steps below walk through wiring it yourself.
Goal
The goal is simple: when the scene becomes ready, the graph logs a message.
This is intentionally small, but it uses the editor in a realistic way and gives you a reliable starting point before you move on to pick events, scene properties, or custom event flows.
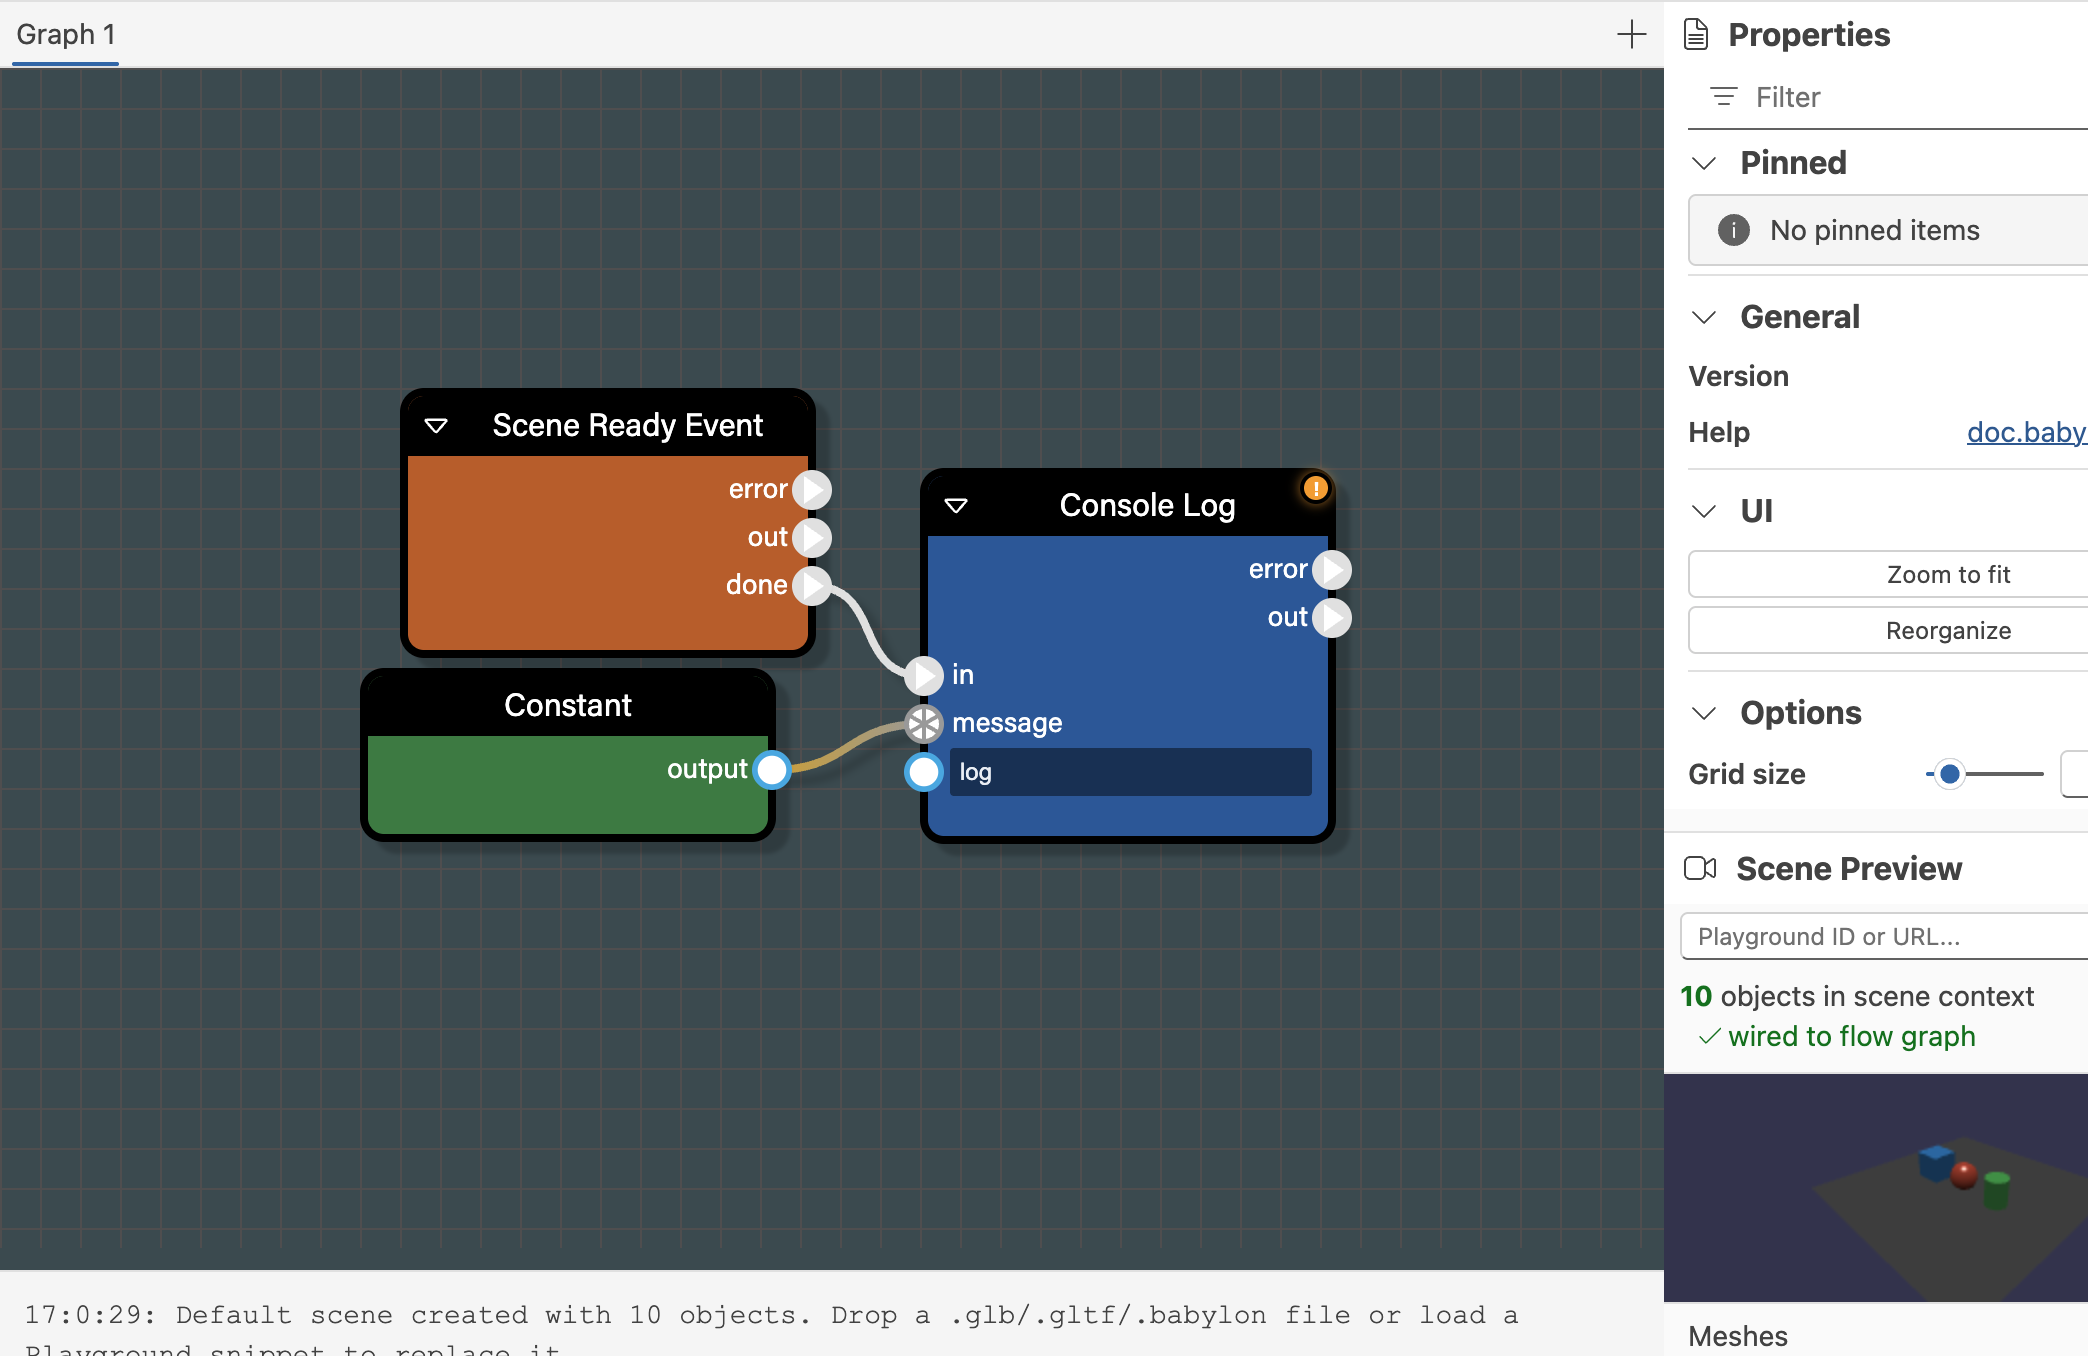
Blocks Used
SceneReadyEventConstantConsoleLog
You can find these blocks in the following families:
SceneReadyEventin EventsConstantin Data AccessConsoleLogin Utility
Step By Step
1. Start With The Default Scene
Open the editor without loading any external content. The default scene gives you a safe environment for first experiments.
2. Add SceneReadyEvent
From the Events family, add SceneReadyEvent to the canvas.
This block is your execution entry point. It fires once the scene is ready to be used.
3. Add Constant
From Data Access, add a Constant block.
In the property panel:
- Set the constant type to
String. - Enter a short message such as
Test.
4. Add ConsoleLog
From Utility, add ConsoleLog.
This block is useful for first experiments because it gives immediate confirmation that the graph executed as expected.
5. Connect The Graph
Make two connections:
- Connect the execution output
doneofSceneReadyEventto the execution input ofConsoleLog. - Connect the output
valueofConstantto the value inputmessageofConsoleLog.
At that point, the graph has both the control flow and the data it needs.
6. Run The Graph
Press Start.
When the graph runs, the event should fire and the message should be logged.
If you want to confirm execution visually:
- Turn on Debug Mode.
- Run the graph again.
- Watch the active blocks highlight as the graph executes.
What You Learn From This Example
Even this tiny graph teaches the core authoring pattern:
- Events start execution.
- Data blocks provide values.
- Execution blocks perform actions.
- The graph can be inspected visually and iterated quickly.
That pattern scales directly into larger scenes and more complex interactions.
Good Next Steps
After this example, natural follow-ups are:
- Replace
SceneReadyEventwith a pointer or pick event. - Replace
ConsoleLogwith a property-changing or animation-driving block. - Add validation, naming, and notes so the graph is easier to maintain.
For deeper reference, continue with Editor Operations and Shortcuts, Validation and Property Editing, and Block Reference.
If you want the next practical step, continue with Example - Click A Mesh And Log It.
Further reading
Flow Graph Editor
Build Babylon.js flow graphs visually with a UI-first editor for interactive scenes.
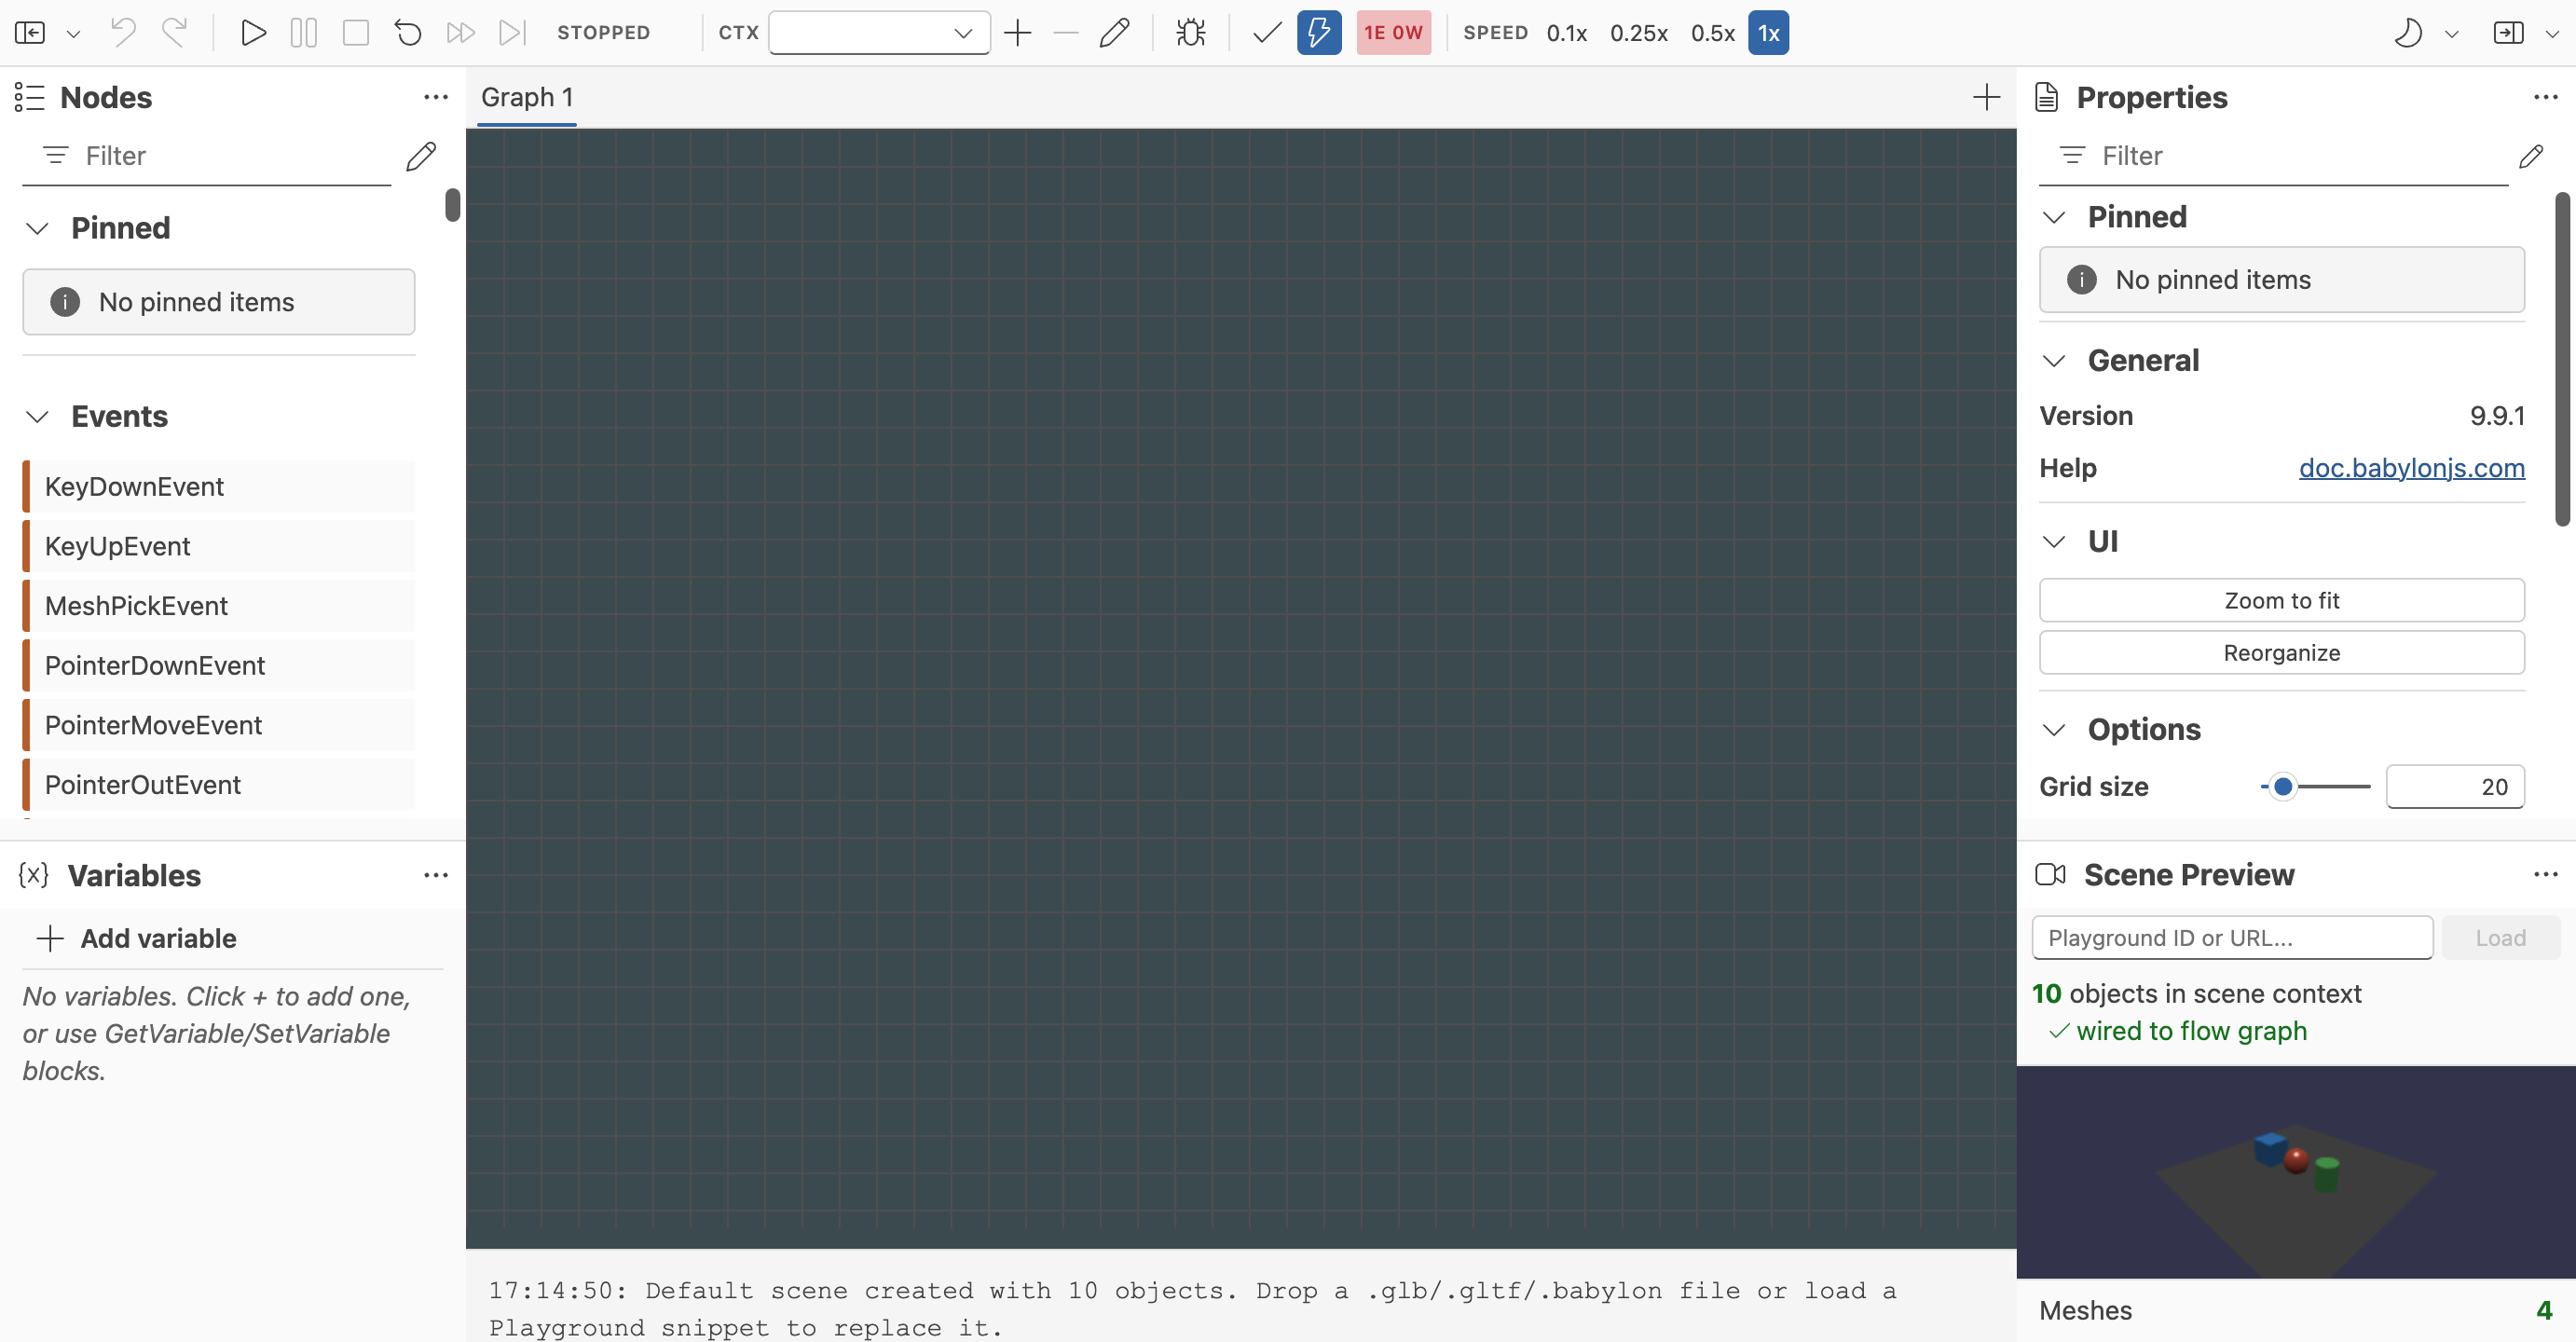
Getting Started With The Flow Graph Editor
Learn the basic workflow for creating, testing, saving, and restoring flow graphs in the Babylon.js Flow Graph Editor.

Block Reference
First-pass reference for the current blocks available in the Babylon.js Flow Graph Editor.