Authoring, Validation, and Debugging
Execution Controls
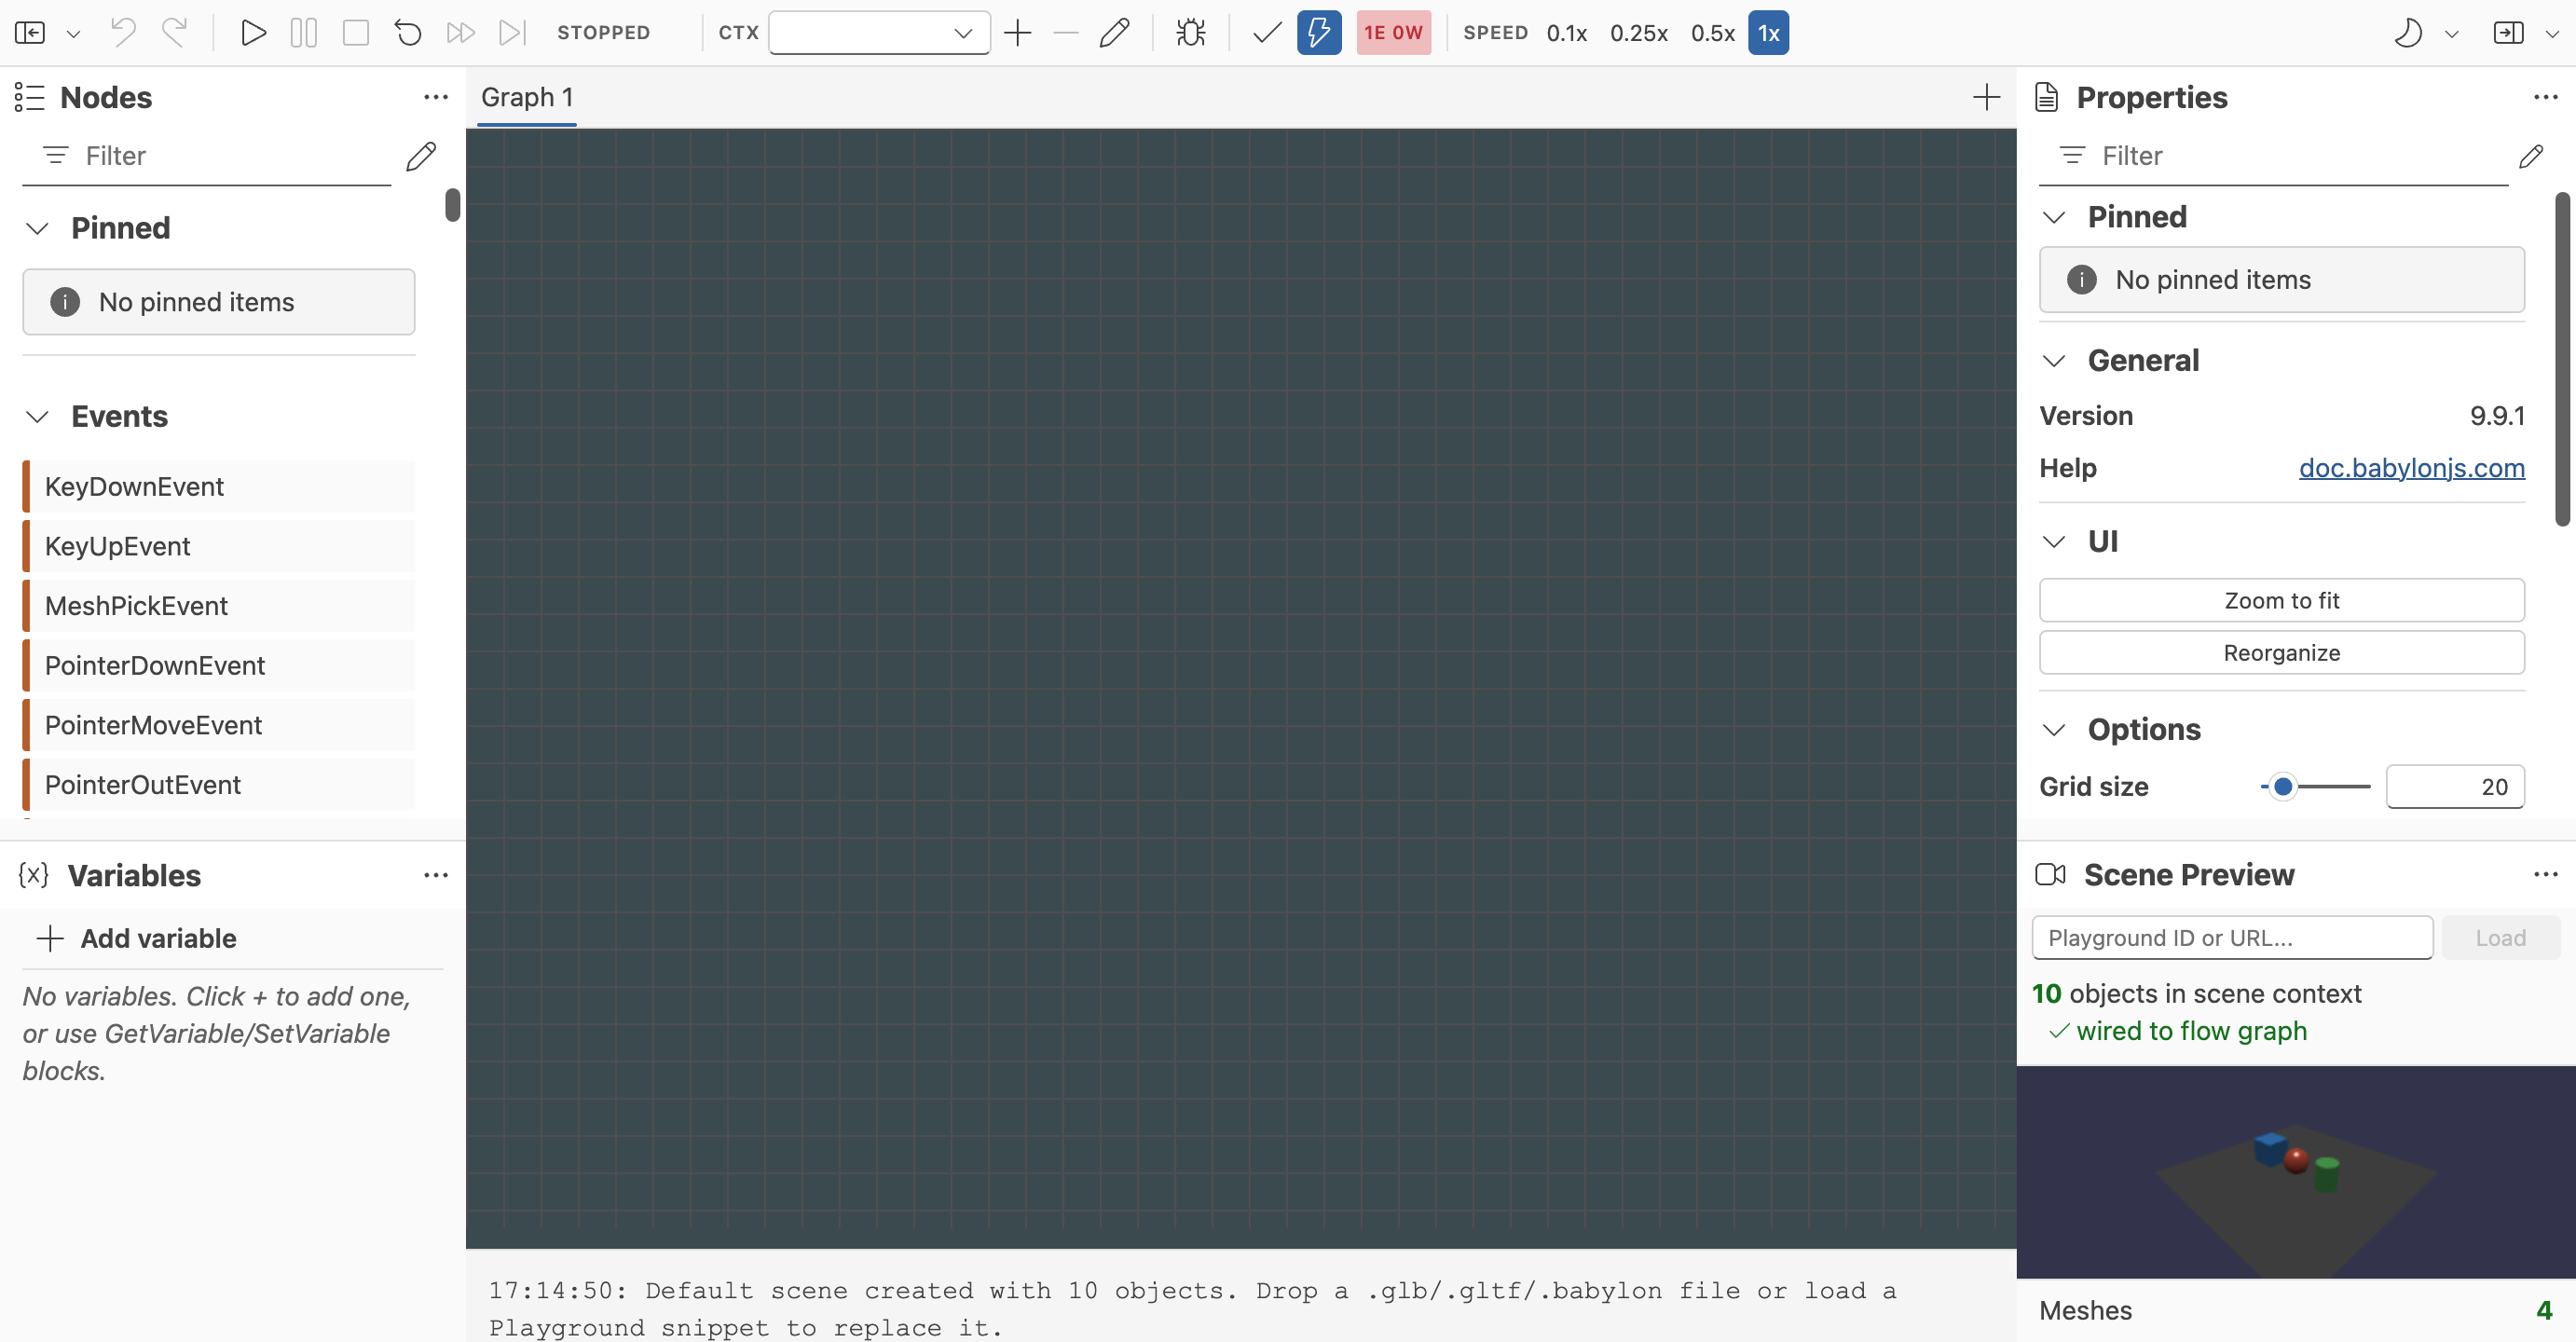
The editor is built for quick test cycles. Once a graph is connected, you can control execution directly from the toolbar:
- Start the graph
- Pause execution
- Stop execution and clear runtime state
- Reset the graph and reload the test scene when needed
The toolbar also shows the current graph state, making it easy to distinguish between stopped, running, paused, and breakpoint-driven execution.
The toolbar can also be used to select which execution context is active. When a graph uses multiple execution contexts, the active selection determines which runtime instance the editor is inspecting.
Time Scale And Replay
The editor can slow execution down or speed it up. This is especially useful for graphs that depend on timing, interpolation, physics, or event ordering.
Lower speeds help when you want to watch a graph execute step by step. Higher speeds are helpful when validating loops, repeated events, or longer-running transitions.
Visual Debugging
Debug Mode adds live visual feedback to graph execution. When enabled, the editor can show:
- Which blocks just executed
- Which ports received or emitted data
- The direction of flow through active connections
This is one of the most important differences between authoring a graph visually and assembling it only through code. You can see execution as it happens and identify the exact point where behavior diverges from your expectation.
Breakpoints And Stepping
Execution blocks can be paused with breakpoints, which lets you inspect a graph before a specific action runs.
In practice, a breakpoint workflow looks like this:
- Enable Debug Mode.
- Select an execution block.
- Toggle its breakpoint.
- Run the graph until execution pauses.
- Continue or step through the next block.
This is particularly helpful when tracing conditional branches, state transitions, and event chains that would be hard to reason about from the final scene behavior alone.
When multiple execution contexts exist, breakpoints and stepping should be interpreted in the currently selected context rather than as a single global runtime view.
For the full model, see Execution Contexts.
Validation While You Edit
The editor can validate graphs for structural and configuration problems.
Manual validation is useful before saving or sharing a graph. Live validation is useful while building because it catches issues earlier, especially in larger graphs where one missing or incompatible connection can be easy to miss.
Validation is closely related to the editor's connection rules. Data ports carry typed values, and the editor prevents incompatible links from being accepted. That means many graph mistakes are caught at authoring time instead of only at runtime.
For the detailed rules behind validation, type compatibility, and the property panel, see Validation and Property Editing.
The Property Panel
When you select a block, the property panel becomes the main place for editing its configuration.
Depending on the block, the panel may expose:
- General metadata such as the block name or comments
- Construction settings that define how the block behaves
- Default values for unconnected inputs
- Specialized editors for scene-dependent references
Some blocks offer custom editors for scene assets, meshes, animation groups, constants, switch cases, variables, or custom event payloads. This is where the loaded scene context becomes especially valuable: the editor can present scene-aware pickers instead of making you type identifiers blindly.
Organizing Large Graphs
As graphs grow, editor ergonomics matter as much as the blocks themselves. The Flow Graph Editor already includes several tools for keeping larger graphs workable:
- Smart groups for bundling related blocks
- Sticky notes for visual annotations
- Search for locating nodes and frames quickly
- A minimap for navigating larger canvases
- Copy and paste for duplicating graph fragments
These features help turn a prototype graph into something that other people can read, maintain, and extend.
To understand where the editor's current nodes are grouped in the palette, see Supported Block Families. For detailed behavior of grouping, clipboard operations, sticky notes, search, and navigation, see Editor Operations and Shortcuts.
Scene-Aware Workflows
Some block families depend on capabilities present in the loaded scene. For example, scene-specific pickers become more useful when meshes, animation groups, physics bodies, or sounds are available in the preview scene.
This matters because the editor is not only a graph canvas. It is also a testing surface for real scene interactions. A graph that edits variables is useful in isolation, but a graph that can target named scene objects, react to collisions, or drive audio becomes much closer to production behavior.
Recommended Authoring Pattern
For larger interactions, a good working pattern is:
- Load the exact scene or a close test scene.
- Build one interaction path at a time.
- Validate after each meaningful change.
- Use debug blocks and breakpoints as soon as the behavior gets more complex.
- Group and annotate the graph before it becomes difficult to read.
As the editor grows, additional pages can expand this section with block catalogs, scene integration guides, and workflow-specific examples.
Further reading
Flow Graph Editor
Build Babylon.js flow graphs visually with a UI-first editor for interactive scenes.
Getting Started With The Flow Graph Editor
Learn the basic workflow for creating, testing, saving, and restoring flow graphs in the Babylon.js Flow Graph Editor.