Debugging and Profiling with PIX
Debugging and Profiling with PIX
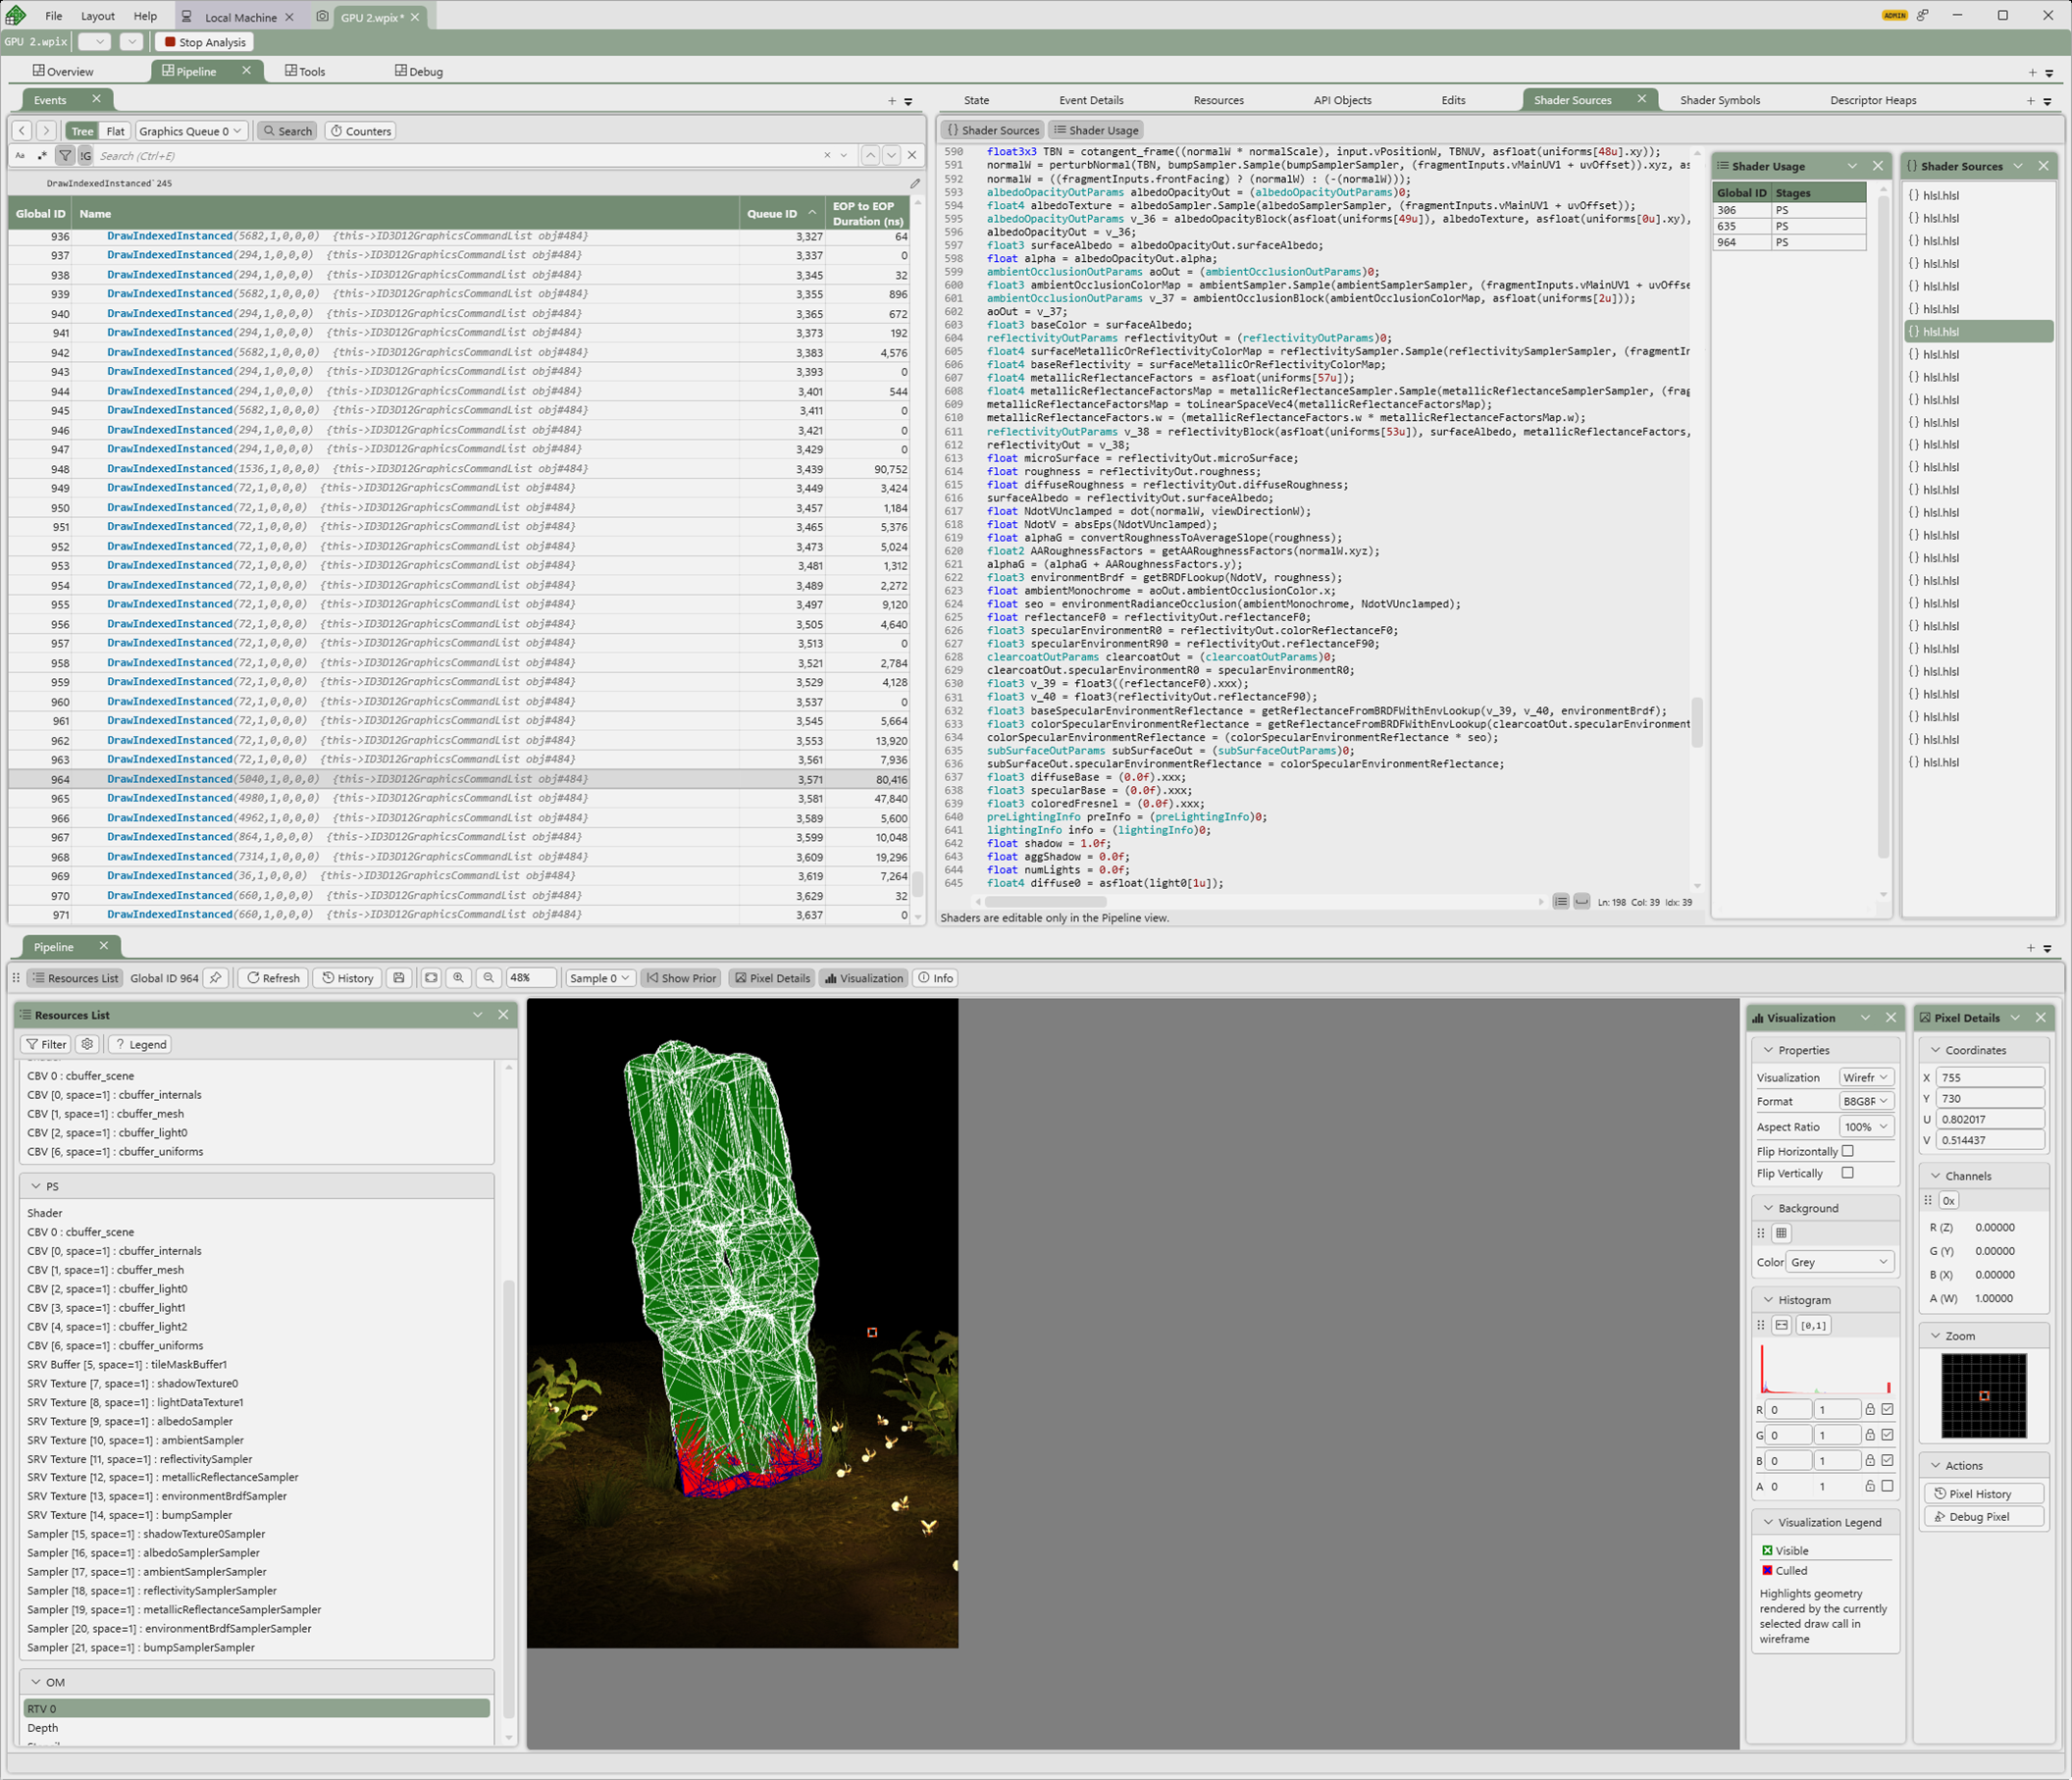
PIX is a performance tuning and debugging tool from Microsoft for DirectX-based applications on Windows. It allows you to capture and analyze GPU workloads, inspect draw calls, profile frame timing, and debug shaders. When used with Babylon.js running on a WebGPU-enabled browser such as Chrome, PIX provides deep visibility into the rendering pipeline, helping you identify performance bottlenecks, verify that GPU resources are being used efficiently, and diagnose visual artifacts at the API level.
Prerequisites
Install PIX 2601.15:
https://devblogs.microsoft.com/pix/download/
Download the WinPixEventRuntime NuGet package, unzip winpixeventruntime.*.nupkg, and copy the bin\x64\*.dll files into your <Chrome Installation Directory> (usually C:\Program Files\Google\Chrome\Application\):
https://www.nuget.org/packages/WinPixEventRuntime
Setting Up the Environment
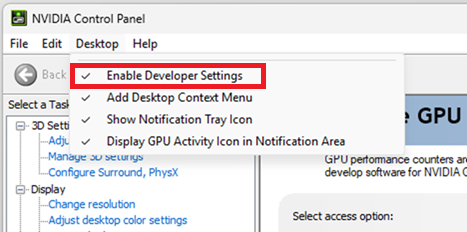
Enable developer settings in the NVIDIA Control Panel:
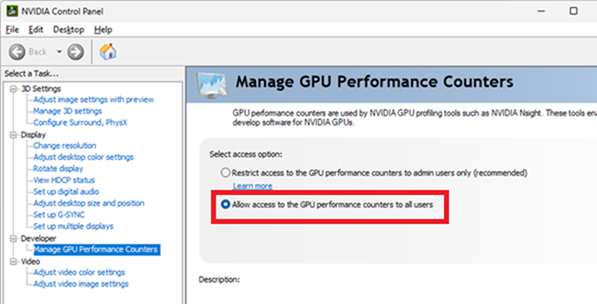
Allow access to GPU counters:
Enable Developer Mode in Windows Settings:
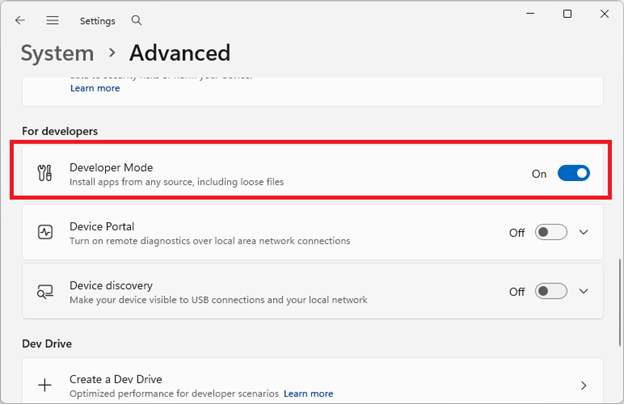
Launching the Process
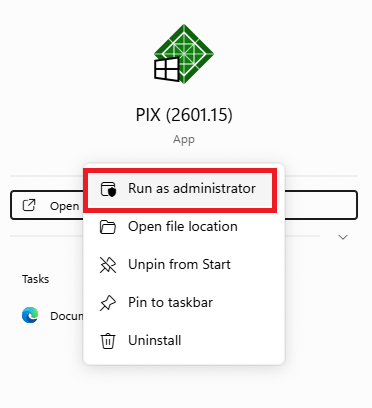
Launch PIX with administrator privileges (right-click and select "Run as administrator"). This is required for PIX to access GPU hardware counters and inject into the Chrome GPU process.
In PIX, select Launch Process from the home screen and configure it with the following settings:
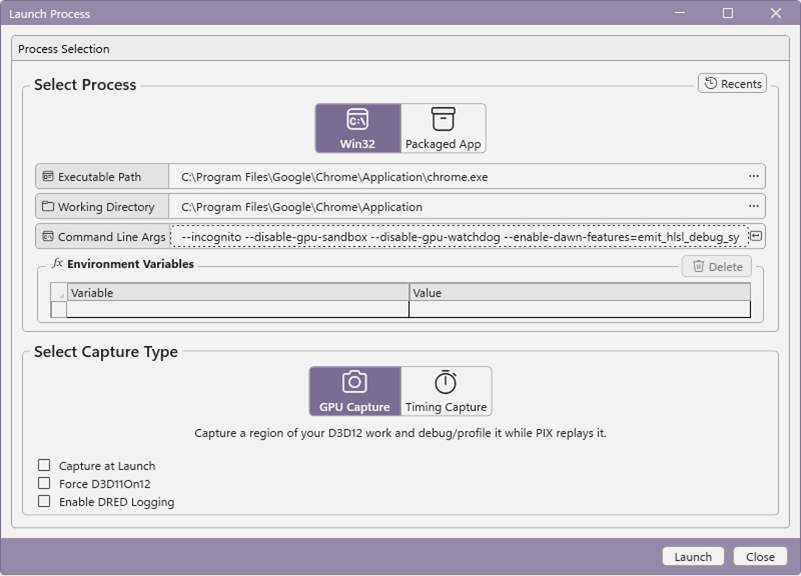
Executable Path: <Chrome Installation Directory>/chrome.exe
Working Directory: <Chrome Installation Directory>
Command Line Args: --incognito --disable-gpu-sandbox --disable-gpu-watchdog --disable-direct-composition --enable-dawn-features=emit_hlsl_debug_symbols,disable_symbol_renaming https://playground.babylonjs.com/?inspectorv2=true&engine=webgpu#DR9MT2#35
| Chrome option used to launch | Description |
|---|---|
--incognito | Launches Chrome in incognito mode so that extensions and cached state do not interfere with the capture. |
--disable-gpu-sandbox | Disables the GPU process sandbox, allowing PIX to inject into and communicate with the GPU process. |
--disable-gpu-watchdog | Prevents Chrome from killing the GPU process when a frame takes too long, which is common while PIX is capturing or single-stepping through draw calls. |
--disable-direct-composition | Disables Windows DirectComposition, forcing Chrome to use a swap chain that PIX can intercept for frame capture. |
--enable-dawn-features=emit_hlsl_debug_symbols,disable_symbol_renaming | Enables Dawn (Chrome's WebGPU implementation) features: emit_hlsl_debug_symbols includes debug information in the generated HLSL shaders, and disable_symbol_renaming preserves original variable and function names so they are readable in PIX's shader debugger. |
GPU Capture
A GPU capture records a single frame of rendering activity, letting you inspect every draw call, resource binding, and pipeline state in detail. After launching Chrome through PIX, click the GPU Capture button (camera icon) on the PIX toolbar to capture the current frame. Once the capture completes, PIX opens an analysis view where you can step through each API call, examine textures and buffers at any point in the frame, and debug shaders directly.
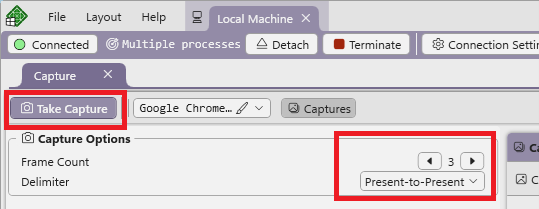
Timing Capture
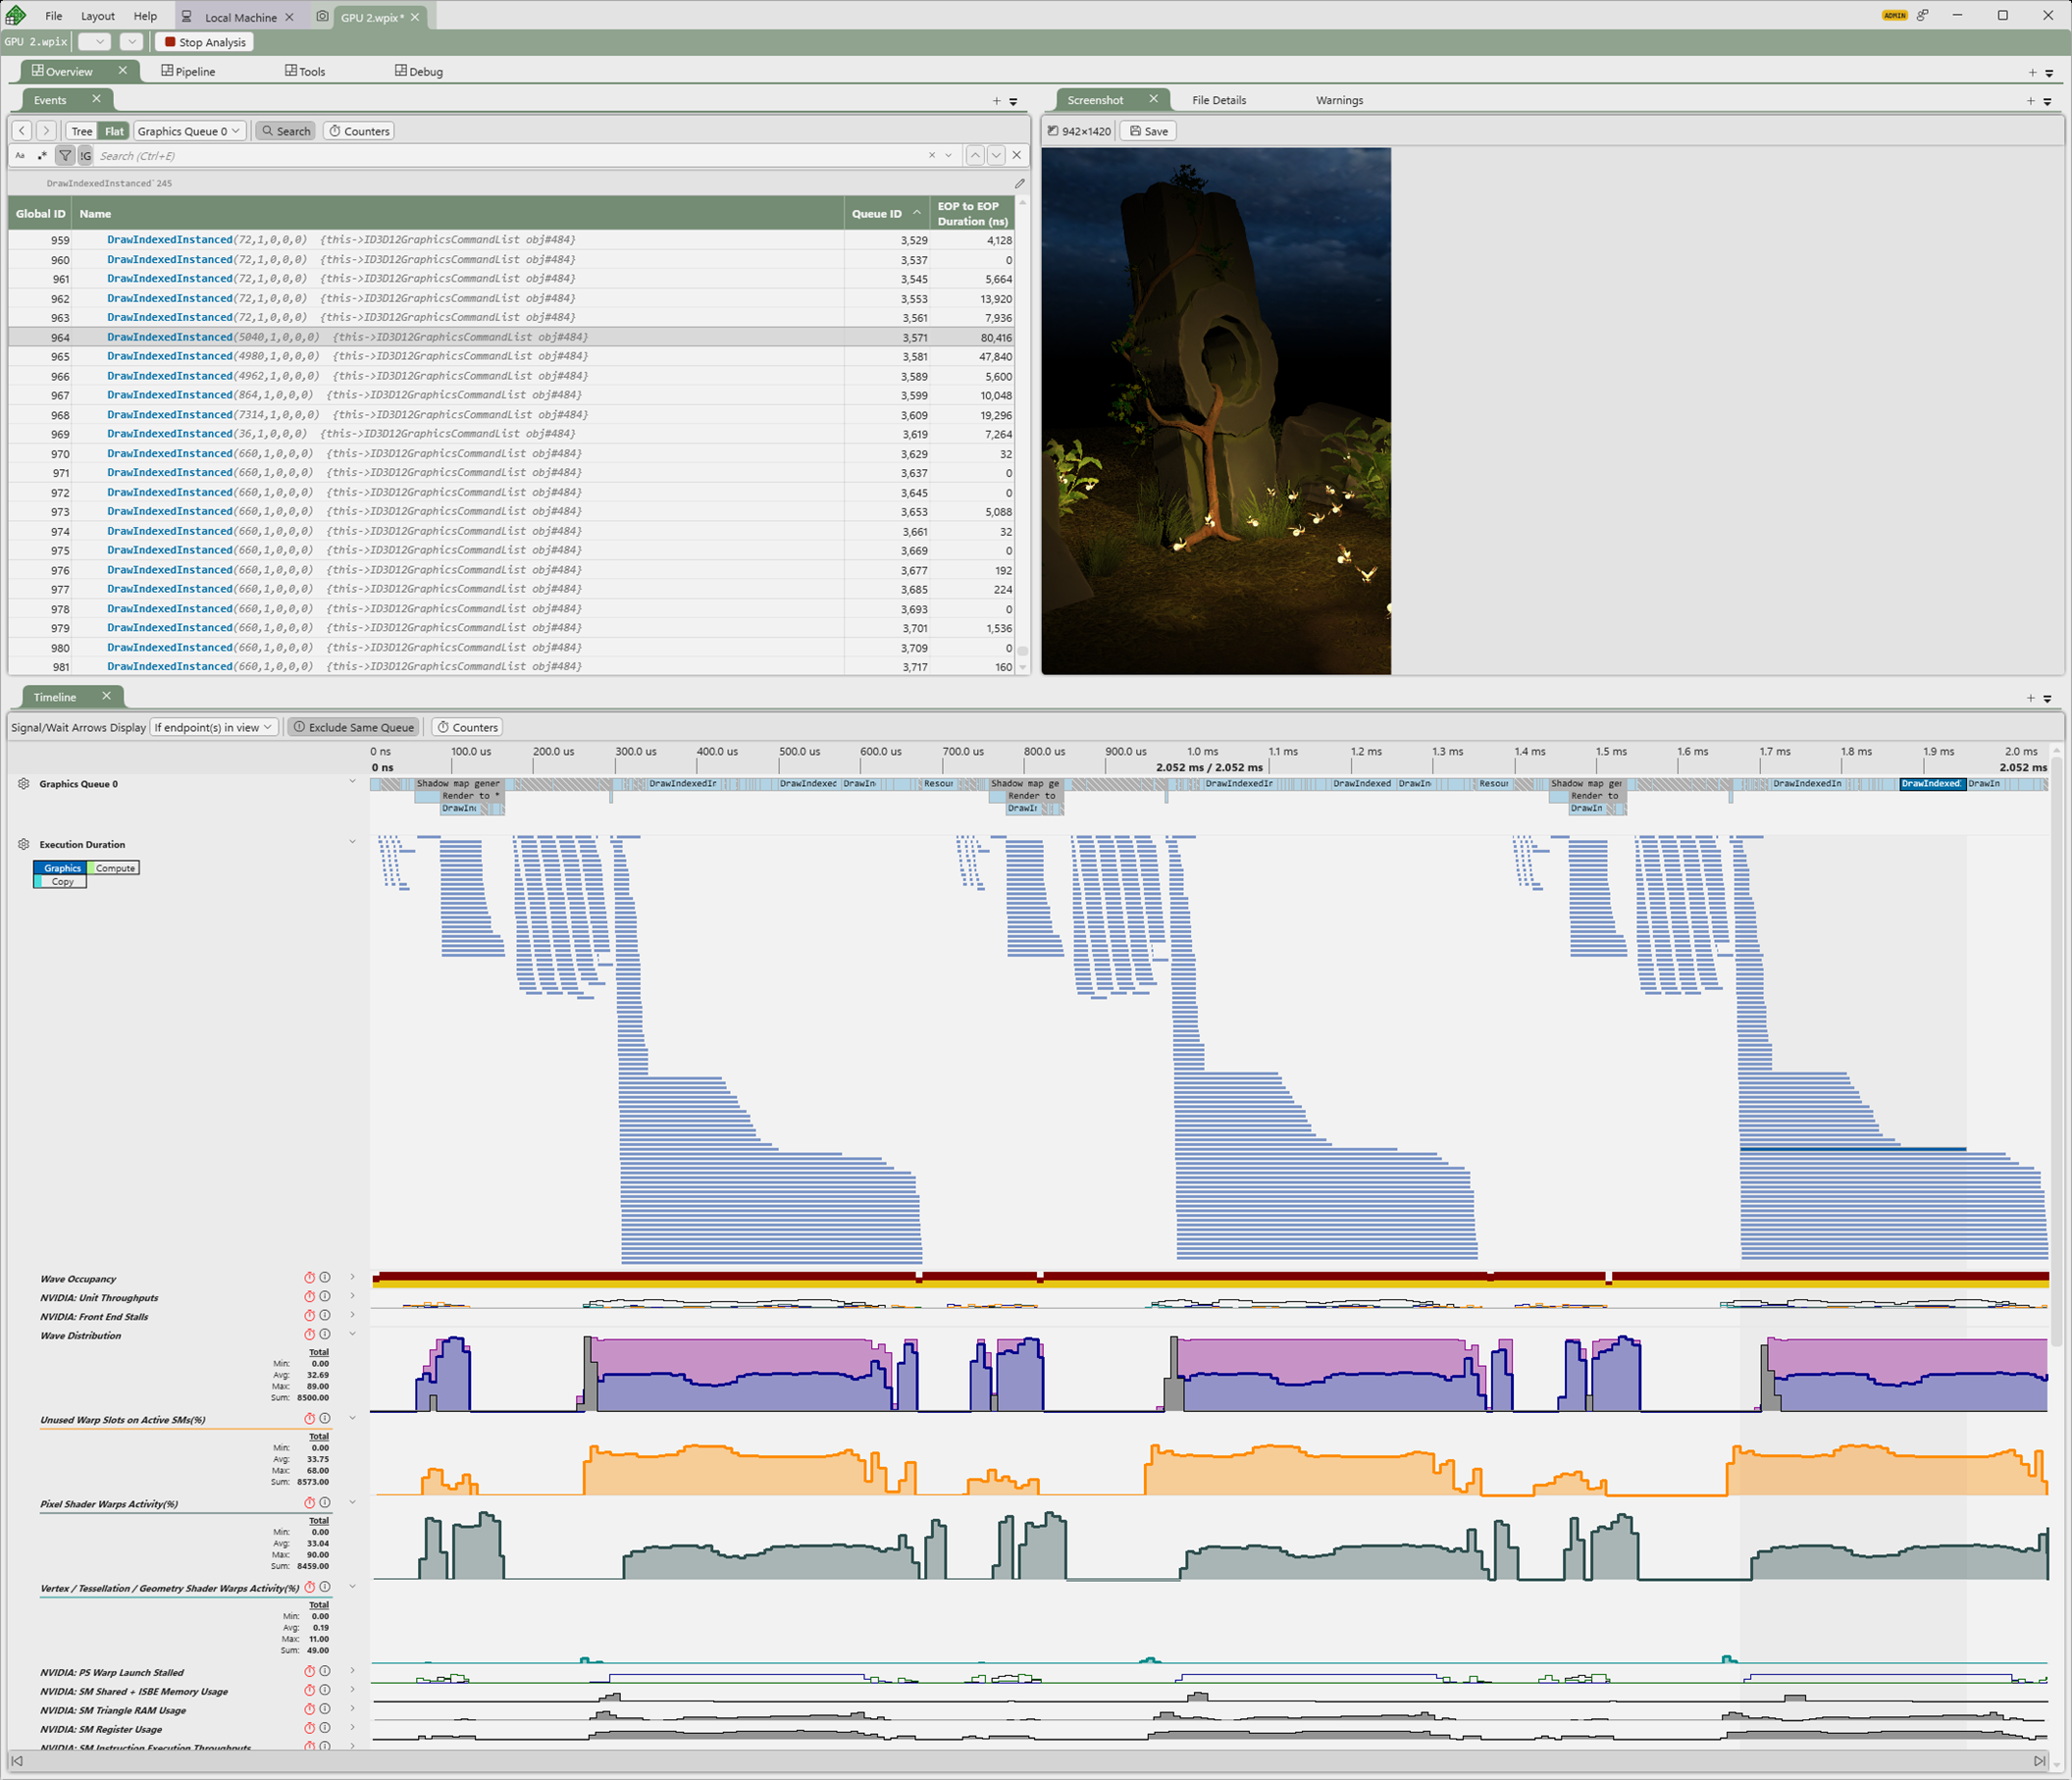
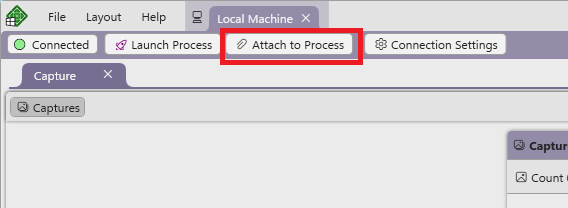
A timing capture profiles GPU and CPU activity over a span of multiple frames, giving you a timeline view of how work is distributed. Unlike a GPU capture, a timing capture requires you to manually attach to the correct Chrome process. Launch the process as described above, then use Attach to Process:
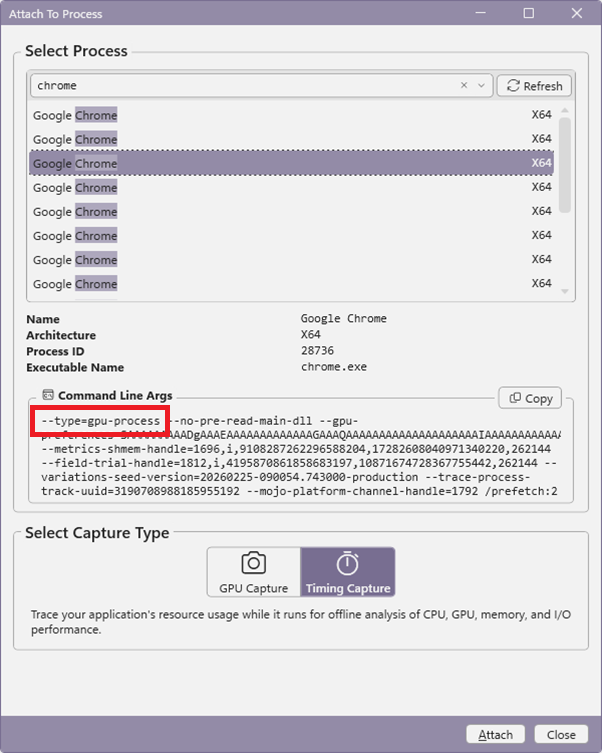
Select the Chrome process whose command line contains --type=gpu-process.
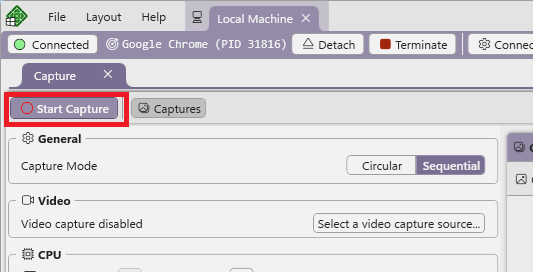
Once attached, click the Timing Capture button (stopwatch icon) on the PIX toolbar to begin recording, let the scene run for the desired duration, then click the button again to stop. The resulting timeline shows GPU queue utilization, command list execution, and hardware counter data, making it straightforward to identify bottlenecks such as GPU-bound passes, excessive state changes, or pipeline stalls.
Additional Resources
This article covers how to set up PIX for use with Babylon.js and WebGPU. For a deeper understanding of PIX itself — including how to navigate captures, interpret timeline data, and debug shaders — the following Microsoft resources are great starting points.
Analyzing frames with GPU captures
https://learn.microsoft.com/en-us/windows/win32/direct3dtools/pix/articles/gpu-captures/pix-gpu-captures
Timing Captures - The Timeline layout
https://learn.microsoft.com/en-us/windows/win32/direct3dtools/pix/articles/timing-captures/layouts/pix-timing-captures-timeline-layout
Videos showing how to use the PIX on Windows tool for performance tuning and debugging DirectX 12 games
https://www.youtube.com/playlist?list=PLeHvwXyqearWuPPxh6T03iwX-McPG5LkB